Are Sequence Similarity Networks Coming Of Age?
Sequence Similarity Networks have been in use for almost 20 years but not everybody is familiar with what they are and how they can be used.
Essentially they are a very simple way of representing evolutionary history. In many ways there are like phylogenetic trees and in many ways they are not. The nodes on a sequence similarity network (SSN) can represent a sequence and the edges connecting those nodes can either be homology edges or perhaps co-occurrence edges.
However the fundamental unit of the entire network is a pair of nodes that are united by an edge.

In this case, node 1 and node 2 are connected, either because some (all) of their sequences are homologous to one another, or because they are both found together on the same DNA or protein sequence. In the former case, this would be a Sequence Similarity Network and in the latter case, it would be a co-occurrence network. I will use the terms Network and Graph interchangeably.
The entire graph can be found as a single connected component or there may be multiple connected components in the graph.
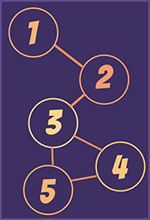
Two nodes are in the same connected component if there is at least one path that can be traveled from one node to the other. Sometimes, this path might have to go through other nodes and some times this path is direct – a path length of 1.
A Clique is a set of nodes that are maximally connected – they are all connected to each other. In the first connected component above we can see that nodes 3, 4 and 5 are a clique and also that 1 and 2 are a clique and 2 and 3 are a clique. However, 1, 2 and 3 are not a clique because they are not maximally connected.
This brings us to the notion of a Shortest path. Unlike a phylogenetic tree, there may be multiple ways of traversing a graph in order to go from one node to another. Therefore, we are often interested in the shortest path you need to travel, rather than some arbitrary round-about path between two nodes. There might be more than one shortest path uniting two nodes.
The Degree of a node is the number of edges that connect to this node. A high degree node is often a very central, important node in a graph.
Nodes can be central in the network or they can be peripheral and that might be a very interesting thing to analyse. There are a few kinds of centrality measure. Closeness centrality is a measure of how far away, on average, a node is from the rest of the nodes. A central node on the graph will be closer than a peripheral node. Betweenness centrality is a different concept. Betweenness centrality is a measure of how many shortest paths must go through this node. Betweenness centrality is interesting because it often picks out nodes that join communities of nodes in a graph.
If recombination never happened then every homologous family would form a kind of clique provided there was no false negative identification of homologies. However we do know that recombination does occur. This means that there are paths relating groups of sequences. Chimeric sequences hold a graph together and facilitate the formation of giant connected components.
There is no way of representing this entire evolutionary history on a single phylogenetic tree.
At the moment we really are using off the shelf software and methods in order to construct these networks, However in future it would be awesome to have software that understood the kind of data we are looking at. It would be great to relate evolution along network edges to mutations and changes in the composition of proteins and nucleotides. We have no doubt this will happen soon.